Statistical Nouns in Research English and Data Analysis

 This article explains key categories of statistical nouns used in research, covering measurement, variation, results, and significance. It highlights their use in methods and results sections, common learner mistakes, and offers practice exercises.
- Main categories of statistical nouns in research
- Measurement and variation nouns in analysis
- Result and significance nouns in reporting
- Statistical nouns in methods and results sections
- Precision and caution in statistical noun choice
- Typical learner confusion with technical statistics nouns
- Practice: apply statistical nouns in research-style sentences
Understanding how researchers employ specialized terminology to convey numerical information provides valuable insight into the language of scientific investigation. This article examines the specific vocabulary used in academic writing for interpreting and reporting data, highlighting how precise word choices help communicate complex findings clearly and accurately. By analyzing these terms, readers can better appreciate the conventions that guide effective scientific communication and the importance of clarity when presenting research results.
Main categories of statistical nouns in research
Understanding the various types of nouns used in research statistics helps readers interpret academic papers and data analysis more accurately. These nouns typically fall into distinct groups based on their function, specificity, and role in describing data, methods, or findings.
Descriptive statistical nouns
These nouns refer to values and measures that summarize or describe features of a dataset. They are foundational for reporting research results and making comparisons.
- Mean → The mean of the test scores increased after the new teaching method was introduced.
- Median → The median income is lower than the mean because of a few very high salaries.
- Mode → The mode of the distribution is 7, as it appears more often than any other value.
- Range → The range of ages in the sample extends from 18 to 65.
- Variance → A high variance indicates that the data points are widely spread out.
- Standard deviation → The standard deviation of 2.3 shows moderate variation around the mean.
- Percentile → Students in the 90th percentile performed better than most of their peers.
- Quartile → The first quartile marks the point below which 25% of the values fall.
- Frequency → The frequency of each response category is shown in the table.
- Proportion → A large proportion of participants reported positive outcomes.
Inferential statistical nouns

Terms in this category are used to discuss the process of drawing conclusions about populations from sample data. They are closely tied to hypothesis testing and estimation.
- Estimate → The estimate suggests that average satisfaction has increased by 10%.
- Parameter → The parameter of interest is the true mean blood pressure in the population.
- Statistic → The sample mean is a statistic used to approximate the population mean.
- Confidence interval → The 95% confidence interval indicates the likely range of the true value.
- P-value → A p-value below 0.05 is often taken as evidence against the null hypothesis.
- Significance → Statistical significance does not always imply practical importance.
- Hypothesis → The null hypothesis assumes that there is no difference between the groups.
- Test → A t-test was used to compare the average scores of the two classes.
- Sample → The sample consisted of 250 university students from three faculties.
- Population → The population includes all registered voters in the country.
Data and variable-related nouns
These nouns describe the raw materials of quantitative research: the data points and their classifications. They are essential for discussing data collection and structure.
- Variable → Age was treated as a continuous variable in the analysis.
- Observation → Each observation corresponds to one participant in the study.
- Dataset → The dataset contains over 15,000 lines of survey data.
- Case → Each case in the file represents a separate household.
- Score → The highest score on the test was 98 out of 100.
- Group → Participants were randomly assigned to either the control or experimental group.
- Level → Education level was coded as primary, secondary, or tertiary.
- Category → The category “other” was used for responses that did not fit the main options.
- Measurement → The measurement of height was recorded in centimetres.
- Scale → Responses were rated on a five-point Likert scale from “strongly disagree” to “strongly agree”.
Comparison of statistical noun roles
To clarify the distinctions among these groups, consider the structured overview below:
| Type of Noun | Typical Function in Research |
|---|---|
| Descriptive | Summarizes or characterizes data (e.g., mean, range, frequency) |
| Inferential | Supports conclusions about populations and hypothesis testing (e.g., parameter, p-value, confidence interval) |
| Data/Variable | Specifies the elements, structure, or types of information analyzed (e.g., variable, observation, dataset) |
| Process/Procedure | Refers to the methods or steps in statistical analysis (e.g., test, method, analysis, model) |
Understanding these groupings enables clearer communication of findings, more precise writing, and improved interpretation of research literature. Whether discussing measures, drawing inferences, or describing datasets, choosing the appropriate statistical noun is crucial for scholarly accuracy.
Measurement and variation nouns in analysis
Nouns describing measurement and variation are central to how research findings are interpreted and communicated. These terms enable writers to convey not just the presence of data, but the ways in which data can differ, fluctuate, or be quantified. In research English, such vocabulary is essential for specifying the degree, frequency, or pattern of observed phenomena.
Common measurement nouns
Measurement-related nouns often serve to indicate quantities, magnitudes, or amounts. They help to specify exactly what is being assessed and provide clarity in reporting results. Some of the most widely used nouns in this category include:
- level → The stress level among participants decreased after the intervention.
- amount → The amount of time spent online was higher in younger age groups.
- rate → The unemployment rate fell slightly during the final quarter.
- volume → The volume of traffic on the website doubled in six months.
- concentration → The concentration of pollutants in the river exceeded legal limits.
- proportion → A large proportion of respondents preferred digital materials.
- frequency → The frequency of errors declined after the software update.
- intensity → The intensity of the training programme increased each week.
- extent → The extent of the damage was greater than initially expected.
- score → The average score on the final exam improved compared to last year.
- density → Population density is highest in the central districts.
- degree → The degree of agreement among experts was surprisingly high.
Variation nouns in research writing
Variation nouns capture differences, changes, or fluctuations within datasets. Their precise use can clarify whether results are consistent, variable, or subject to change under different conditions. The following terms are frequently found in research articles:
- variance → High variance in test scores suggests unequal levels of preparation.
- fluctuation → Seasonal fluctuation in demand affects production planning.
- spread → The spread of the data points indicates how similar the responses are.
- range → A narrow range of values points to relatively stable performance.
- diversity → Greater diversity in the sample improves the generalisability of the findings.
- heterogeneity → Considerable heterogeneity across studies complicates comparison.
- deviation → A large deviation from the mean may signal an outlier.
- dispersion → Low dispersion suggests that the scores cluster around the average.
- consistency → High consistency across trials strengthens the reliability of the results.
- stability → The stability of the measurements was confirmed over several weeks.
- irregularity → The irregularity of the pattern makes prediction difficult.
- distribution → The distribution of responses is skewed toward higher values.
Usage patterns in academic analysis
Writers often pair these nouns with specific adjectives or qualifiers to provide nuance. For example, "high variance," "low frequency," or "moderate degree" are common collocations. The choice of noun can also signal the analytical focus: "variance" suggests statistical analysis, while "diversity" might highlight ecological or demographic perspectives.
| Measurement Noun | Typical Context/Example |
|---|---|
| Rate | The rate of infection increased over time. |
| Variance | Variance in test scores was analyzed across groups. |
| Distribution | The distribution of responses was skewed. |
| Proportion | A large proportion of participants agreed. |
| Range | The temperature range was narrow. |
| Frequency | Frequency of errors declined post-intervention. |
Understanding and selecting the appropriate measurement or variation noun is crucial for accurate data analysis. These terms help readers grasp the nature of the evidence, the degree of difference or similarity, and the reliability of the findings.
Result and significance nouns in reporting
In research writing, particular nouns are frequently used to describe outcomes and the importance of findings. These "result" and "significance" terms play a crucial role in structuring data commentary, guiding readers through interpretations and implications. Mastery of this vocabulary helps writers present their analyses with clarity and precision, especially when distinguishing between observed outcomes and their broader relevance.
Common nouns for reporting outcomes
Writers often rely on a set of nouns to label and discuss the results of experiments, surveys, or other forms of data analysis. These nouns allow for succinct reporting and facilitate comparison between different studies or datasets. Examples include:
- Finding → The main finding of the study is that sleep duration affects academic performance.
- Outcome → The outcome of the intervention was a noticeable drop in anxiety levels.
- Result → This result supports earlier research on bilingual education.
- Observation → One important observation was the rapid decline in attendance.
- Trend → The trend toward remote work has accelerated since the pandemic.
- Pattern → A clear pattern emerged, with older participants reporting higher satisfaction.
- Difference → The difference between the control and experimental groups was statistically significant.
- Increase → There was a small increase in test scores after the training session.
- Decrease → The decrease in error rates indicates better system reliability.
- Improvement → A marked improvement in reading skills was recorded after six months.
- Reduction → The reduction in hospital admissions eased pressure on local services.
- Effect → The effect of the new policy was visible within a few weeks.
- Relationship → The relationship between stress and productivity is complex.
- Association → A strong association was found between air quality and respiratory illness.
- Correlation → The correlation between the two variables was positive but moderate.
- Change → A sudden change in behaviour was observed after the announcement.
Nouns indicating significance and interpretation
Beyond simply reporting what was found, research articles must also communicate the importance or statistical strength of these findings. This is where nouns related to significance become essential. They help to frame the implications and reliability of the results.
- Significance → The significance of these results lies in their potential impact on policy.
- Implication → One key implication is that early intervention may prevent later problems.
- Relevance → The relevance of the study extends beyond the field of education.
- Validity → The validity of the conclusions depends on the quality of the data.
- Robustness → The robustness of the findings was tested using several alternative models.
- Confidence → The wide interval reduces our confidence in the exact estimate.
- Significance level → A 5% significance level was used to evaluate the hypothesis.
- Likelihood → The likelihood of such a result occurring by chance is very low.
- Strength → The strength of the association increased after controlling for age.
- Magnitude → The magnitude of the effect was larger than expected.
- Probability → The probability of error was reduced through repeated testing.
- Support → The new data provide strong support for the theoretical model.
- Certainty → Complete certainty is impossible, but the evidence is persuasive.
- Evidence → The evidence consistently points to a positive impact of the programme.
- Limit → One major limit of the study is its small sample size.
Comparing outcome and significance nouns
To better understand the distinction between nouns that describe what was found and those that address how important or reliable those findings are, consider the following structured comparison:
| Outcome-related nouns | Significance-related nouns |
|---|---|
| Result | Significance |
| Trend | Confidence |
| Difference | Probability |
| Effect | Implication |
| Change | Magnitude |
| Association | Evidence |
Usage patterns in academic texts
When these nouns appear in research reporting, they often follow predictable patterns. For example, "The results indicate..." signals a summary of outcomes, while "The significance of this finding is..." introduces interpretation. Academic writers also combine these nouns for clarity: "a statistically significant difference," or "robust evidence for an effect." Understanding these usage conventions can make reporting more precise and persuasive.
Statistical nouns in methods and results sections
Writers of research articles rely on a core set of statistical nouns to describe their study design, data handling, and findings. These terms help ensure clarity and precision when presenting methodology and outcomes. In these two sections, the language is often more technical, focusing on how data is processed and interpreted.
Common statistical nouns in research procedures
When detailing procedures, authors frequently use nouns that specify variables, tools, and analytical strategies. Some of the most frequent include:
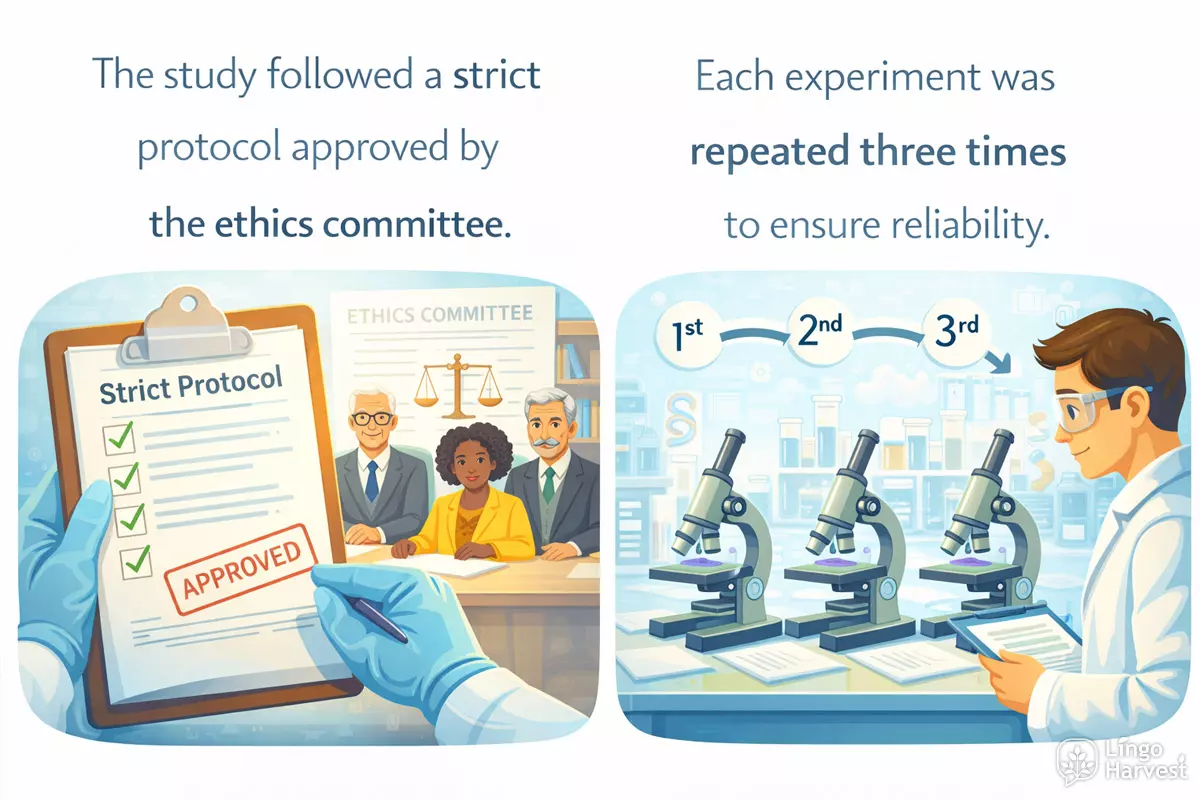
- Protocol → The study followed a strict protocol approved by the ethics committee.
- Experiment → Each experiment was repeated three times to ensure reliability.
- Trial → The clinical trial included both a treatment group and a control group.
- Design → A longitudinal design was chosen to track changes over time.
- Instrument → The questionnaire served as the main measurement instrument.
- Tool → The software tool automatically checked the dataset for missing values.
- Metric → Accuracy was used as the primary performance metric.
- Index → The researchers created an index to summarise overall risk.
- Algorithm → A clustering algorithm was applied to identify subgroups in the data.
- Workflow → The data analysis workflow was documented step by step.
- Pipeline → All images were processed through the same analysis pipeline.
- Calibration → Regular calibration of the sensors ensured precise readings.
- Randomisation → Randomisation was used to assign participants to groups.
- Allocation → Allocation of resources was based on project priority.
- Recruitment → Participant recruitment took place over a period of six months.
- Screening → A brief screening interview was conducted before enrolment.
- Coding → Open-ended responses underwent thematic coding.
- Administration → Test administration followed standardised instructions.
- Implementation → The implementation of the procedure was monitored closely.
- Replication → Replication of the study in other contexts is strongly recommended.
These nouns serve as anchors for describing each step of the analysis, from data collection to statistical testing.
Contrasts between methods and results vocabulary
The methods section typically uses nouns linked to process and design, while the results section shifts focus to outcomes and interpretations. For instance, "procedure," "protocol," and "instrument" are common in the methods, whereas "finding," "result," "difference," and "correlation" often appear in results.
| Methods Section Nouns | Results Section Nouns |
|---|---|
| Procedure | Finding |
| Sample | Difference |
| Variable | Correlation |
| Instrument | Effect |
| Measurement | Result |
| Hypothesis | Significance |
Patterns in noun usage
Writers tend to use unambiguous, countable nouns to describe discrete elements of their studies. For example, "observation" and "estimate" pinpoint specific data points or calculations. Abstract nouns like "significance" or "variance" are more likely to appear when discussing interpretation or implications.
Conclusion
Careful selection of statistical nouns enhances the precision and readability of research articles. Recognizing which terms are most suitable for each section can help writers communicate their methodology and findings more effectively.
Precision and caution in statistical noun choice
Selecting the right noun when describing data, methods, or findings is central to clarity in research writing. Unlike casual prose, academic English demands exactness, especially when referencing statistical elements. Ambiguity or overgeneralization can mislead readers or obscure the intended meaning. For instance, “result” and “outcome” may seem interchangeable, but each carries subtle distinctions in statistical reporting.
Why accurate noun selection matters
Specificity in terminology avoids misinterpretation. Each statistical noun—like “estimate,” “parameter,” or “distribution”—refers to a distinct concept. Misusing these terms can lead to confusion about the data or the analysis performed. Careful word choice is also a mark of professionalism and rigor in scholarly communication.
Common pitfalls and how to avoid them
- Confusing “mean” (average value) with “median” (middle value).
- Using “variable” when “factor” or “predictor” is intended.
- Referring to an “observation” when “measurement” or “record” would be more accurate.
- Stating “significance” without specifying “statistical significance.”
- Equating “data” (plural) with “datum” (singular), or treating “data” as singular.
- Calling a “sample” a “population” or vice versa.
- Mislabeling “error” as “residual” or “variance,” which have specific meanings.
- Referring to “confidence interval” when “prediction interval” is correct.
- Interchanging “rate” and “ratio” without regard to their definitions.
- Describing “trend” when only “fluctuation” is shown.
Examples of nuanced statistical nouns
To highlight the importance of careful word selection, consider these frequently used statistical nouns and their typical meanings:
| Statistical Noun | Typical Usage/Meaning |
|---|---|
| Estimate | An inferred value based on sample data; not the true parameter. |
| Statistic | A calculated measure from a sample (e.g., sample mean, median). |
| Parameter | A fixed value describing a population (e.g., population mean). |
| Observation | One recorded value or case in a dataset. |
| Variable | A measurable attribute that can take different values. |
| Outcome | The result of a random process or experiment. |
| Distribution | The pattern of frequencies or probabilities for possible values. |
| Residual | The difference between observed and predicted values. |
| Significance | Usually refers to statistical significance, not importance in general. |
| Confidence Interval | A range likely to contain the true parameter with a specified probability. |
Guidelines for cautious usage
- Double-check definitions before finalizing terminology in your manuscript.
- Be consistent: use the same noun for the same concept throughout your work.
- When in doubt, clarify meaning with a brief definition or example.
- Avoid jargon unless necessary, and explain it upon first use.
- Consider your readers’ backgrounds; choose terms familiar to your field.
Ultimately, careful noun selection in statistical writing supports both credibility and reader comprehension. By applying vigilance to vocabulary, researchers enhance both the precision and trustworthiness of their communication.
Typical learner confusion with technical statistics nouns
Many learners new to research English or data analysis often stumble over technical nouns used in statistics. This confusion can stem from similar-sounding terms, subtle distinctions in meaning, or differences between everyday and statistical usage. Accurate comprehension of these nouns is essential for interpreting research papers and conducting analyses.
Common sources of confusion
Several factors contribute to misunderstandings:
- Overlap with general English: Words like "significance" or "model" have specific statistical meanings that differ from their everyday use.
- Similar or related terms: Nouns such as "variance" vs. "variation" or "estimate" vs. "estimator" are easily mixed up.
- Unfamiliar plural forms: Terms like "indices" (plural of "index") may surprise learners.
- Acronyms and abbreviations: Statistical writing often uses shorthand (e.g., "ANOVA," "CI") that can be opaque to newcomers.
Frequently confused statistical nouns
Below is a list of technical nouns that often cause difficulties for students and professionals alike. Being able to distinguish these quickly improves both reading and writing in research settings.
- Parameter → Statistic
- Population → Sample
- Mean → Median → Mode
- Variance → Standard deviation
- Confidence interval
- Estimator → Estimate
- Bias → Error
- Null hypothesis → Alternative hypothesis
- Correlation → Causation
- Regression → Prediction
- Distribution (normal, binomial, etc.)
- Outlier
- Residual
- Level of significance (alpha)
- P-value
- Degrees of freedom
- Index → Indices
- Factor
- Variable → Covariate
- Score
Comparing closely related nouns
Some pairs of terms are especially troublesome because their differences are subtle yet meaningful. Here’s a structured comparison to clarify distinctions:
| Noun Pair | Key Distinction |
|---|---|
| Parameter vs. Statistic | Parameter refers to a value describing a whole population; statistic describes a value calculated from a sample. |
| Estimator vs. Estimate | Estimator is a rule or formula for calculating an estimate; estimate is the actual calculated value. |
| Variance vs. Standard Deviation | Variance measures average squared deviation from the mean; standard deviation is the square root of variance, in original units. |
| Confidence Interval vs. Significance Level | Confidence interval gives a range of plausible values; significance level (alpha) is the threshold for rejecting a hypothesis. |
Practical tips to avoid confusion
Learners benefit from checking definitions in context, practicing with real data, and creating glossaries of key terms. It also helps to ask instructors or peers for clarification when encountering unfamiliar statistical nouns. Over time, repeated exposure and usage lead to greater confidence and fewer misunderstandings.
Practice: apply statistical nouns in research-style sentences
Understanding how to use statistical nouns fluently is a key skill for writing clear, precise research English. Below you'll find practical exercises and examples that help you master the use of such nouns in authentic, research-oriented contexts. These activities are designed for learners aiming to strengthen their academic communication, especially in data analysis and reporting findings.
Common Statistical Nouns in Context
The table below presents a range of statistical nouns frequently used in research writing, along with sample sentences. This structured layout demonstrates how each noun functions within a research context.
| Statistical Noun | Example Sentence |
|---|---|
| Mean | The mean of the test scores increased significantly after the intervention. |
| Variance | Variance in income levels was greater among rural participants. |
| Median | The median age of respondents was 35 years. |
| Correlation | There was a strong correlation between exercise frequency and reported well-being. |
| Distribution | The distribution of responses was skewed towards higher satisfaction ratings. |
| Regression | A linear regression was conducted to predict sales based on advertising expenditure. |
| Sample | The sample consisted of 250 randomly selected patients. |
| Significance | The results showed statistical significance at the 0.05 level. |
| Outlier | One outlier was identified and excluded from the final analysis. |
| Parameter | The parameter estimates were consistent with previous studies. |
| Estimate | The estimate for the population mean was calculated using the available data. |
| Frequency | The frequency of adverse events was recorded for each treatment group. |
| Proportion | The proportion of female participants was 60%. |
| Interval | The confidence interval for the difference in means was narrow. |
| Hypothesis | The null hypothesis was rejected based on the observed p-value. |
| Variable | Income was treated as a continuous variable in the analysis. |
| Standard deviation | The standard deviation was used to assess the spread of the data. |
| Probability | The probability of error was estimated to be less than 0.01. |
| Coefficient | The regression coefficient for education level was positive. |
Fill-in-the-Blank Exercise
Complete each sentence with an appropriate statistical noun from the list above:
- The ________ of the dataset was 4.2, indicating the average value.
- A high ________ suggests that the data points are spread out over a large range.
- Researchers calculated the ________ to determine if the relationship was statistically significant.
- The ________ included both male and female participants from different age groups.
- Analysis revealed a single ________ that did not fit the general pattern of the data.
- The ________ shows how often each value occurs in the dataset.
- The ________ of scores extended from 10 to 45.
- The ________ indicates the percentage of the sample that reported high satisfaction.
- The scatter plot suggests a strong positive ________ between hours studied and exam scores.
- The 95% ________ gives the likely range for the true population mean.
Show answers
- mean
- variance
- p-value
- sample
- outlier
- frequency
- range
- proportion
- correlation
- confidence interval
Identify the Statistical Noun
Read each sentence and underline the statistical noun used.
- The confidence interval was calculated for the estimated effect.
- Regression analysis showed a significant predictor variable.
- Standard deviation provided insight into data variability.
- The proportion of positive outcomes increased after the intervention.
- The sample was drawn from three different schools.
- The null hypothesis was rejected at the 5% significance level.
- The p-value indicated strong evidence against the null model.
- The distribution of scores was approximately normal.
- The mean difference between the two groups was small.
- The variance explained by the model was relatively low.
Show answers
- confidence interval
- regression, variable
- standard deviation
- proportion
- sample
- hypothesis, significance level
- p-value
- distribution
- mean
- variance
Quick Practice: Research-Style Sentence Starters
Here are some sentence starters to help you practice using statistical nouns in your own research writing:
- The sample size was determined based on prior studies.
- Variance in responses was minimal across groups.
- The median value indicated a central tendency.
- Regression analysis revealed a significant effect.
- The distribution was approximately normal.
- Significance was established at the 0.01 level.
- The estimate was consistent with theoretical expectations.
- One outlier notably influenced the results.
- The confidence interval ranged from 1.2 to 3.4.
- Probability values supported the main hypothesis.
By practicing with these examples and exercises, you can develop a more confident and accurate use of statistical vocabulary in your research writing and data analysis reports.